10 Webinar Metrics and KPIs to Track for Demonstrable ROI
Stop guessing. Discover essential webinar metrics and KPIs to track for pipeline and revenue growth. Measure registration, ROI, & prove your impact.

You track registrations and attendance. But what about pipeline influenced, content generated, and cost per lead? Most marketing teams stop measuring after the live event. This leaves the biggest part of your webinar's ROI—the long-term value—completely invisible. You can't prove your program's worth or make smart decisions about what to do next.
Your webinar strategy is guesswork without the right data. You don't know what content works, where people lose interest, or which CTAs drive action. This article gives you a clear framework for tracking the webinar metrics and KPIs that show real business impact. We'll cover the full lifecycle, from pre-event promotion to post-event content performance.
You will learn to analyze performance across three stages: pre-event, live, and post-event. We'll cover specific metrics like registration rate, attendance rate, engagement score, drop-off points, on-demand views, pipeline influenced, and even the SEO traffic from your webinar-derived blog posts. You will see how to connect webinar efforts directly to pipeline and revenue. By the end, you'll have a dashboard to report performance and optimize every future webinar.
Pre-Event Webinar Metrics
Your measurement starts before the event goes live. These metrics tell you if your topic and promotion are working.
1. Registration Rate
This is your first reality check. It measures how many people who see your landing page actually sign up. A low rate means your copy, title, or target audience is wrong.
- How to calculate: (Total Registrations ÷ Total Landing Page Visitors) x 100
- What to aim for: A good landing page converts 20-30% of visitors into registrants.
2. Attendance Rate (Show-Up Rate)
This metric tracks the percentage of registrants who attend the live event. The industry average hovers around 40-50%. A high registration but low attendance rate points to a weak reminder sequence or a disconnect in perceived value.
- How to calculate: (Total Live Attendees ÷ Total Registrations) x 100
- To improve: Use automated reminders 24 hours, 1 hour, and 15 minutes before the start time. Ensure your copy is direct. Read our guide on how to increase webinar attendance for more tactics.
Live Webinar Metrics
During the live event, your focus shifts to holding attention. These KPIs measure audience engagement and content resonance.
3. Audience Engagement Score
This isn’t just one number. It’s a composite score based on audience actions. Most webinar platforms track this for you. It includes polls answered, questions asked in the Q&A, chat messages sent, and resources downloaded. High engagement means your content is connecting.
- How to measure: Use your webinar platform’s built-in analytics. Look for a combined "engagement score" or track individual actions.
- To improve: Plan an interaction every 5-7 minutes. Launch a poll. Ask for questions. Drop a link in the chat.

4. Audience Drop-Off Points
Your webinar analytics will show an attention-span timeline. Pay close attention to where people leave. If 30% of your audience leaves during your 10-minute introduction, your intro is too long. If they leave during a specific section, that section needs to be cut or improved. These drop-off points tell you exactly what to fix for your next event and which content is not worth repurposing.
Post-Event and Repurposing ROI Metrics
This is where most teams fail. They stop tracking. The post-event phase is where you find the long-term ROI. These are the most important webinar metrics and KPIs to track.
5. On-Demand Views & Completion Rate
Your live event is just the beginning. The on-demand recording continues to generate leads for months. Track how many people view the recording and what percentage of it they watch. A 50% completion rate for on-demand content is a solid benchmark. Learn the best practices for reporting video completion rate to do this correctly.
6. Pipeline Influenced
This is a critical B2B metric. It connects your webinar directly to sales opportunities. Your CRM should track how many open deals have a key contact who attended your webinar or watched the recording. This proves your webinar's role in moving deals forward. Gartner reports that B2B webinar attendees are 2.5 times more likely to become qualified leads.

7. Cost Per Lead (CPL)
You need to know your numbers. Calculate how much each qualified lead from your webinar costs you. Compare this to your other channels like paid ads or content syndication. This tells you where to invest your budget for the best return.
- How to calculate: Total Webinar Costs (platform, ads, time) ÷ Total Qualified Leads Generated.
- To improve: Automate your webinar repurposing to lower the "time" cost and generate more assets, which in turn generate more leads from a single event.
8. Content Generated Per Webinar (Repurposing ROI)
Stop thinking of a webinar as a one-hour event. Think of it as a content generation machine. A single one-hour webinar can become 47 pieces of content. This is your Repurposing ROI. Track it.
- How to calculate: Count every piece of content you create from one webinar recording. This includes video clips, blog posts, social media updates, audiograms, image quotes, and LinkedIn carousels.
- Why it matters: This metric shows the true productivity of your webinar program. It justifies the initial investment by showing the massive content output.

9. Social Reach from Repurposed Content
Your live webinar might reach 500 people. The repurposed content from that webinar can reach 50,000. Track the impressions and views of every video clip, image quote, and social post you create. Use UTMs to measure the traffic driven back to your site. This is your content amplification factor.
10. SEO Traffic from Webinar-Derived Blog Posts
A webinar transcript is a perfect foundation for an SEO-optimized blog post. This asset works for you 24/7, long after the live event. Track its performance in Google Search Console. Monitor its keyword rankings, organic impressions, and clicks. This organic traffic is a long-term benefit that most marketers never measure.
How RepurposeYourContent Helps You Track What Matters
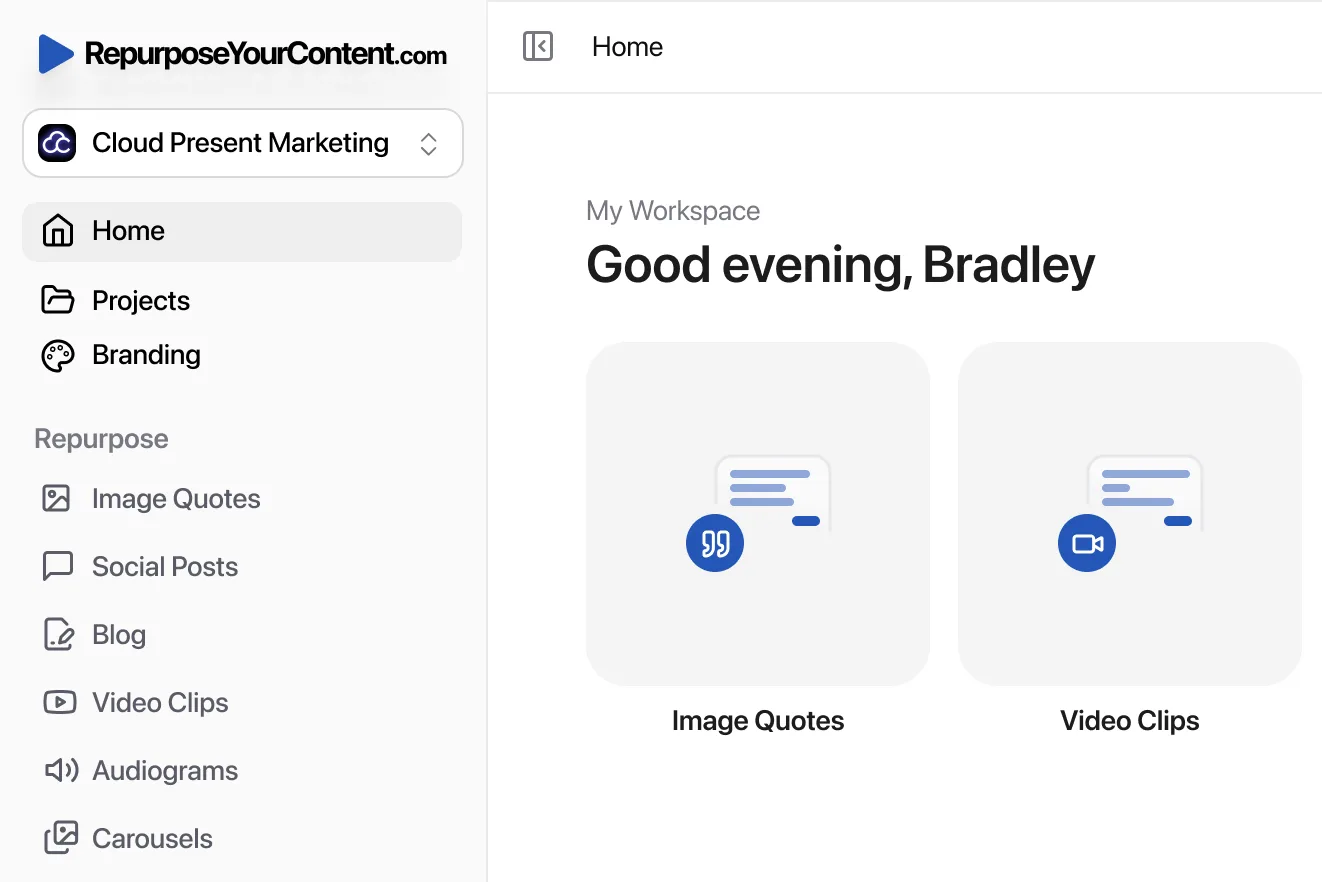
Measuring post-event ROI is difficult if you do it manually. RepurposeYourContent automates the creation of assets and helps you track their performance.
- Content Generation: It automatically turns one webinar into dozens of assets: video clips, SEO-friendly blog posts, social posts, audiograms, image quotes, newsletters, and LinkedIn carousels. This instantly boosts your "Content Generated Per Webinar" metric.
- Analytics: The platform's analytics dashboard tracks the views and engagement on each piece of repurposed content. You can see which clips and topics perform best, informing your future content strategy.
- Efficiency: It generates content based on timestamps from your recording, identifying high-engagement moments to turn into clips. This ensures your social content is built from proven, high-impact moments.
Here’s a simple workflow to track Repurposing ROI:
- Step 1: Upload your webinar recording to RepurposeYourContent. The AI will generate a transcript and identify key topics.
- Step 2: The platform automatically creates a full suite of content assets: 10 video clips, a full blog post, 20 social media posts, and 5 image quotes. Your "Content Generated" metric is now 36.
- Step 3: Use the platform’s scheduler and analytics to distribute these assets and track their reach and engagement. This data feeds directly into your "Social Reach" and traffic metrics.
This workflow takes you from one hour of content to a month's worth of marketing assets in minutes. You get a direct line of sight into your post-webinar performance. For a full breakdown, see our guide on how to get more ROI from webinars.
Stop Measuring Vanity. Start Measuring Value.
Tracking the right webinar metrics and KPIs is not an academic exercise. It's how you prove your marketing contributes to revenue. The old model of counting registrations is broken. It ignores the engagement, pipeline, and long-term content value that truly matter.
You now have a framework to measure what counts:
- Pre-Event: Registration and attendance rates.
- Live Event: Engagement and drop-off points.
- Post-Event: On-demand views, pipeline influence, CPL, and Repurposing ROI.
The most critical step is to start tracking post-event metrics. This is where you will find the hidden value of your webinar program. An effective process for tracking and acting on these metrics requires reliable data. Learn how to measure data quality for B2B teams to ensure your decisions are based on accurate information.
Stop guessing your impact and start proving it. A single webinar is not a one-off event. It's a scalable asset that can build your brand and generate revenue for months. Start tracking the right metrics to demonstrate it. For more on creating webinars that deliver business results, read our article on how to host a webinar that converts.
Ready to turn your webinar recordings into a measurable content engine? Start your free trial of RepurposeYourContent today.
Tags: